December 27, 2022
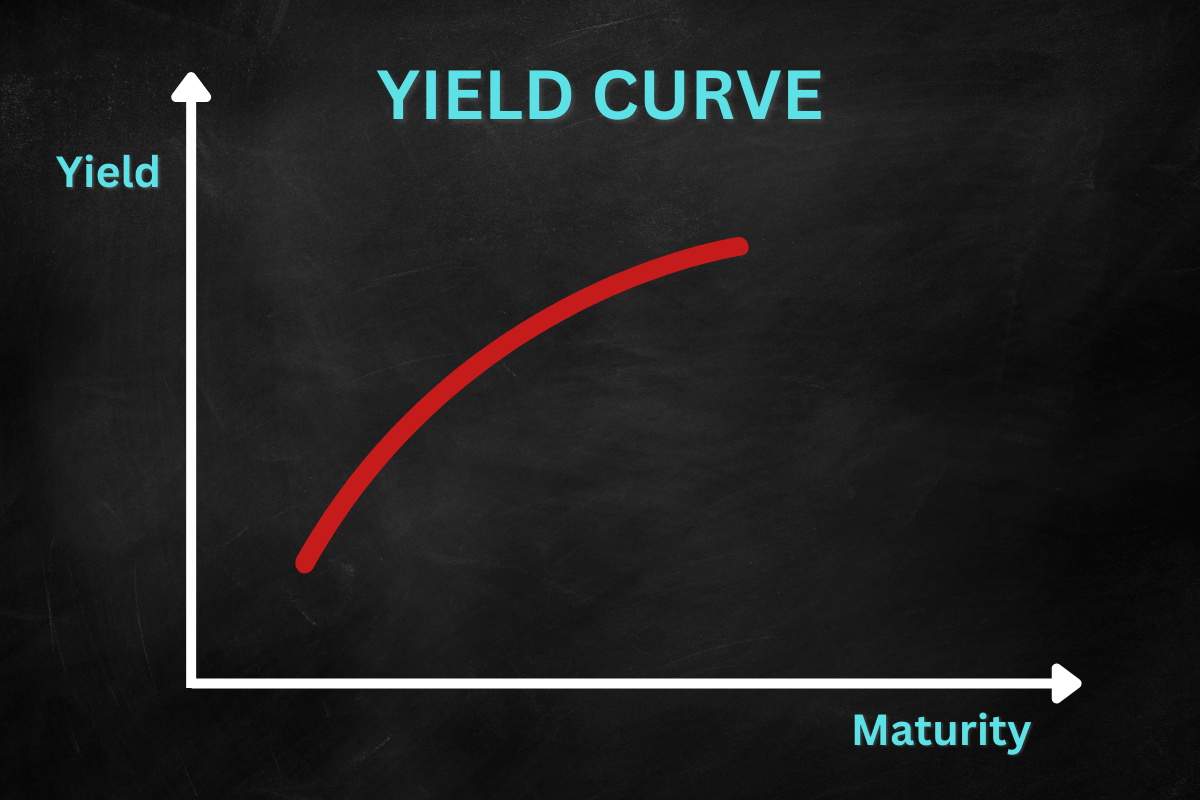
A yield curve shows a snapshot relationship between yield to maturity and time to maturity for a given bond or fixed income security. Imagine a simple graph with an x and a y axis. The time to maturity (such as using 10-year or 2-year Treasuries) lies on the horizontal x axis; the yield, which reflects the interest rate, is on the vertical y axis. If you plot a series of points for several time maturities on x, and the corresponding interest yields on y, you will produce a curve. No need, though, to get out your graph paper and pencil. A significant yield curve change will be widely telegraphed in the media.
Your curve most often will slope up from the southwest to the northeast. Money, like everything else, has a price. That slope, which describes the price of lending/borrowing, reveals an intuitive element of investor behavior. Basically, people will lend/borrow at short maturities for relatively tiny interest compensation, but they demand higher rates for longer periods, extending out into an uncertain future. In other words, they need to be paid more to lock up their money.
The slope of the 10-year Treasury is commonly used, but you can also apply any set of different maturities to compare rates on a level playing field. Finance professionals like to look at the difference between a long- and a short-term rate, particularly the 10- and 2-year Treasuries. (By contrast, economists and academic researchers prefer to observe the 10-year against the 3-month Treasuries. Don’t fret. The good news is both tend to be correlated, moving along the same track.)
Predicting the next recession
Now let’s connect all those dots. First, be aware that yield curves are most helpful for gleaning a general sense of economic direction, rather than making a precise prediction.
Yield curve shapes sometimes deviate from the more standard upward curve. That unusual pattern indicates that investors lack confidence in the near-term economy. When the Federal Reserve tightens, lifting short-term rates, the latter may even surpass longer-term rates, causing the curve to do a back flip and invert. Yet the pattern is really just a depiction of what is going on, rather than a direct cause of a recession.
Markets watch inversions with bated breath. However, they may occur for a host of reasons, including job growth, retail sales or industrial production. For instance, in August 2019, the 10-year briefly dipped to 1.65%, beneath the 1-year note yield of 1.75%. At the time, after a series of rate hikes amid a tight labor market, fears of an impending recession loomed. The Fed, taking note, reversed course and averted a serious recession. Much more recently, on April 1, 2022, the yield curve inverted again, but was it an April Fool’s Day joke?
Maybe not. Since 1955, all recessions have been preceded by a Treasury yield inversion, according to the Federal Reserve Bank of San Francisco.
The grace period
The final question remains, how long does it take between the signal of the inversion and the start of the inevitable recession? The answer is frustratingly vague. You can wait anything from six to 16 months before the dreaded recession strikes. Moreover, sometimes the curve also emits false signals (1966 and 1986), which warn of only a slowdown rather than a full-fledged recession.
Economists, being economists, of course argue about how long the gap is likely to persist between the inversion and the recession, as well as which of the yield curve measurements is most successful at nailing the event. If it does take many months to play out, investors should at least have ample time to prepare their portfolios.
Of course, there are a lot of factors at play here, and you shouldn’t make major changes in your portfolio based just on this information. But it’s another tool to use, and knowledge can help you have a productive discussion with any financial adviser.
Hobe & Lucas Certified Public Accountants, Inc. is a full-service accounting and business consulting firm dedicated to providing clients with exceptional value.
Upload 8879 Make A PaymentAdvisory Services offered through Avantax Planning Partners, Inc., a registered investment adviser. Securities may be offered through Cetera Wealth Services, LLC, member FINRA/SIPC. Additional advisory services may be offered through Cetera Investment Advisers LLC. Cetera named entities and Avantax Planning Partners, Inc. are affiliated. 3390 Asbury Rd, Dubuque, IA 52002. 563-582-2855.
Check your Financial Professionals registration status on https://brokercheck.finra.org/ and/or https://adviserinfo.sec.gov/.
Cetera named entities and Avantax Planning Partners, Inc. are independent of and unrelated to Hobe & Lucas Certified Public Accountants, Inc.